Data Wranggling with tidyverse in R

Object

Learn how to clean, manipulate, and transform data using the tidyverse package in R

Introduction

Data wrangling is the process of cleaning, manipulating, and transforming raw data into a more suitable format for data analysis. In R, the tidyverse package is an essential tool for data wrangling. It is a collection of R packages designed for data science, including dplyr, tidyr, ggplot2, and readr. In this tutorial, we will focus on using dplyr and tidyr for data wrangling tasks.

Dataset: For this tutorial, we will use the mtcars dataset, which is a built-in dataset in R. It contains data about 32 cars, including their miles per gallon (mpg), number of cylinders (cyl), and horsepower (hp), among other variables.

Let’s get started!

Load the required packages and dataset

First, we will install and load the tidyverse package and then load the mtcars dataset.

# Install the tidyverse package if not already installed
if (!requireNamespace("tidyverse", quietly = TRUE)) {
  install.packages("tidyverse")
}

# Load the tidyverse package
library(tidyverse)
── Attaching core tidyverse packages ──────────────────────── tidyverse 2.0.0 ──
✔ dplyr     1.1.3     ✔ readr     2.1.4
✔ forcats   1.0.0     ✔ stringr   1.5.0
✔ ggplot2   3.4.4     ✔ tibble    3.2.1
✔ lubridate 1.9.3     ✔ tidyr     1.3.0
✔ purrr     1.0.2     
── Conflicts ────────────────────────────────────────── tidyverse_conflicts() ──
✖ dplyr::filter() masks stats::filter()
✖ dplyr::lag()    masks stats::lag()
ℹ Use the conflicted package (<http://conflicted.r-lib.org/>) to force all conflicts to become errors
# Load the mtcars dataset
data(mtcars)

About Tidyverse

The tidyverse is a collection of R packages designed to make data science tasks more efficient, consistent, and enjoyable. The main philosophy behind the tidyverse is the concept of “tidy data,” which emphasizes a consistent structure for data manipulation and visualization. Tidy data has a simple structure, where each variable forms a column, each observation forms a row, and each cell contains a single value.

Motivation:

The motivation for the tidyverse came from the need for a coherent set of tools for data manipulation and analysis that adhere to a consistent grammar and data structure. This consistency reduces the cognitive load for users, making it easier to learn and apply various tools across different stages of the data science pipeline.

The tidyverse was created by Hadley Wickham and is now maintained by a team of developers. The main goals of the tidyverse are:

  1. Encourage a consistent and efficient workflow for data manipulation and visualization.

  2. Make data analysis more intuitive, reducing the learning curve for newcomers.

  3. Provide a comprehensive set of tools for common data science tasks.

  4. Promote best practices in data science, including reproducibility and clear communication.

Main packages:

Some of the key packages included in the tidyverse are:

  1. dplyr: A package for data manipulation that provides a set of functions for filtering, sorting, selecting, and mutating data, as well as performing grouped operations and joining datasets. You can find a cheatsheet for this package.

  2. ggplot2: A powerful package for data visualization based on the Grammar of Graphics, which allows for the creation of complex and customizable plots using a layered approach. You can find a cheatsheet for this package.

  3. tidyr: A package for cleaning and reshaping data, with functions for pivoting data between wide and long formats, handling missing values, and more. Please see this cheatsheet for this package.

  4. readr: A package for reading and writing data that provides functions for importing and exporting data in various formats, including CSV, TSV, and fixed-width files.

  5. tibble: A modern take on data frames that offers a more consistent and user-friendly interface, with enhanced printing and subsetting capabilities.

  6. stringr: A package for working with strings, offering a consistent set of functions for common string manipulation tasks, such as concatenation, splitting, and pattern matching.

  7. forcats: A package for working with categorical data, providing functions for creating, modifying, and summarizing factors.

Exploring the dataset

Before diving into data wrangling, let’s explore the mtcars dataset.

# View the first few rows of the dataset
head(mtcars)
                   mpg cyl disp  hp drat    wt  qsec vs am gear carb
Mazda RX4         21.0   6  160 110 3.90 2.620 16.46  0  1    4    4
Mazda RX4 Wag     21.0   6  160 110 3.90 2.875 17.02  0  1    4    4
Datsun 710        22.8   4  108  93 3.85 2.320 18.61  1  1    4    1
Hornet 4 Drive    21.4   6  258 110 3.08 3.215 19.44  1  0    3    1
Hornet Sportabout 18.7   8  360 175 3.15 3.440 17.02  0  0    3    2
Valiant           18.1   6  225 105 2.76 3.460 20.22  1  0    3    1
# Get a summary of the dataset
summary(mtcars)
      mpg             cyl             disp             hp       
 Min.   :10.40   Min.   :4.000   Min.   : 71.1   Min.   : 52.0  
 1st Qu.:15.43   1st Qu.:4.000   1st Qu.:120.8   1st Qu.: 96.5  
 Median :19.20   Median :6.000   Median :196.3   Median :123.0  
 Mean   :20.09   Mean   :6.188   Mean   :230.7   Mean   :146.7  
 3rd Qu.:22.80   3rd Qu.:8.000   3rd Qu.:326.0   3rd Qu.:180.0  
 Max.   :33.90   Max.   :8.000   Max.   :472.0   Max.   :335.0  
      drat             wt             qsec             vs        
 Min.   :2.760   Min.   :1.513   Min.   :14.50   Min.   :0.0000  
 1st Qu.:3.080   1st Qu.:2.581   1st Qu.:16.89   1st Qu.:0.0000  
 Median :3.695   Median :3.325   Median :17.71   Median :0.0000  
 Mean   :3.597   Mean   :3.217   Mean   :17.85   Mean   :0.4375  
 3rd Qu.:3.920   3rd Qu.:3.610   3rd Qu.:18.90   3rd Qu.:1.0000  
 Max.   :4.930   Max.   :5.424   Max.   :22.90   Max.   :1.0000  
       am              gear            carb      
 Min.   :0.0000   Min.   :3.000   Min.   :1.000  
 1st Qu.:0.0000   1st Qu.:3.000   1st Qu.:2.000  
 Median :0.0000   Median :4.000   Median :2.000  
 Mean   :0.4062   Mean   :3.688   Mean   :2.812  
 3rd Qu.:1.0000   3rd Qu.:4.000   3rd Qu.:4.000  
 Max.   :1.0000   Max.   :5.000   Max.   :8.000  

The mtcars dataset is a classic built-in dataset in R, often used for teaching and demonstrating various data analysis and visualization techniques. It originates from the 1974 Motor Trend US magazine and contains information about 32 different car models, primarily from the 1973-1974 model years.

The dataset consists of 11 variables, which include various specifications and performance metrics for each car. The variables in the mtcars dataset are:

  1. mpg: Miles per gallon (fuel efficiency)

  2. cyl: Number of cylinders in the engine

  3. disp: Engine displacement, measured in cubic inches

  4. hp: Gross horsepower

  5. drat: Rear axle ratio

  6. wt: Weight of the car, in thousands of pounds

  7. qsec: 1/4 mile time, a measure of acceleration

  8. vs: Engine type (0 = V-shaped, 1 = straight)

  9. am: Transmission type (0 = automatic, 1 = manual)

  10. gear: Number of forward gears

  11. carb: Number of carburetors


Glimpse!

glimpse(mtcars)
Rows: 32
Columns: 11
$ mpg  <dbl> 21.0, 21.0, 22.8, 21.4, 18.7, 18.1, 14.3, 24.4, 22.8, 19.2, 17.8,…
$ cyl  <dbl> 6, 6, 4, 6, 8, 6, 8, 4, 4, 6, 6, 8, 8, 8, 8, 8, 8, 4, 4, 4, 4, 8,…
$ disp <dbl> 160.0, 160.0, 108.0, 258.0, 360.0, 225.0, 360.0, 146.7, 140.8, 16…
$ hp   <dbl> 110, 110, 93, 110, 175, 105, 245, 62, 95, 123, 123, 180, 180, 180…
$ drat <dbl> 3.90, 3.90, 3.85, 3.08, 3.15, 2.76, 3.21, 3.69, 3.92, 3.92, 3.92,…
$ wt   <dbl> 2.620, 2.875, 2.320, 3.215, 3.440, 3.460, 3.570, 3.190, 3.150, 3.…
$ qsec <dbl> 16.46, 17.02, 18.61, 19.44, 17.02, 20.22, 15.84, 20.00, 22.90, 18…
$ vs   <dbl> 0, 0, 1, 1, 0, 1, 0, 1, 1, 1, 1, 0, 0, 0, 0, 0, 0, 1, 1, 1, 1, 0,…
$ am   <dbl> 1, 1, 1, 0, 0, 0, 0, 0, 0, 0, 0, 0, 0, 0, 0, 0, 0, 1, 1, 1, 0, 0,…
$ gear <dbl> 4, 4, 4, 3, 3, 3, 3, 4, 4, 4, 4, 3, 3, 3, 3, 3, 3, 4, 4, 4, 3, 3,…
$ carb <dbl> 4, 4, 1, 1, 2, 1, 4, 2, 2, 4, 4, 3, 3, 3, 4, 4, 4, 1, 2, 1, 1, 2,…
Data Wrangling tasks

Selecting columns

Let’s say you’re only interested in analyzing the mpg, hp, and wt (weight) columns. You can use dplyr’s select() function to choose specific columns.

# Select mpg, hp, and wt columns
selected_data <- mtcars %>%
  select(mpg, hp, wt)

head(selected_data)
                   mpg  hp    wt
Mazda RX4         21.0 110 2.620
Mazda RX4 Wag     21.0 110 2.875
Datsun 710        22.8  93 2.320
Hornet 4 Drive    21.4 110 3.215
Hornet Sportabout 18.7 175 3.440
Valiant           18.1 105 3.460

Sometimes, we need to pull() only a vector from the dataset.

# pull mpg as a vector
mtcars %>%
  pull(mpg)
 [1] 21.0 21.0 22.8 21.4 18.7 18.1 14.3 24.4 22.8 19.2 17.8 16.4 17.3 15.2 10.4
[16] 10.4 14.7 32.4 30.4 33.9 21.5 15.5 15.2 13.3 19.2 27.3 26.0 30.4 15.8 19.7
[31] 15.0 21.4

Use sample_frac() to select a random fraction of the dataset:

# Select a random 50% of the dataset
sampled_frac <- mtcars %>%
  sample_frac(0.5)

glimpse(sampled_frac)
Rows: 16
Columns: 11
$ mpg  <dbl> 21.0, 30.4, 24.4, 14.7, 15.2, 17.3, 19.2, 10.4, 15.5, 22.8, 16.4,…
$ cyl  <dbl> 6, 4, 4, 8, 8, 8, 8, 8, 8, 4, 8, 8, 8, 4, 4, 8
$ disp <dbl> 160.0, 75.7, 146.7, 440.0, 304.0, 275.8, 400.0, 472.0, 318.0, 108…
$ hp   <dbl> 110, 52, 62, 230, 150, 180, 175, 205, 150, 93, 180, 245, 264, 109…
$ drat <dbl> 3.90, 4.93, 3.69, 3.23, 3.15, 3.07, 3.08, 2.93, 2.76, 3.85, 3.07,…
$ wt   <dbl> 2.875, 1.615, 3.190, 5.345, 3.435, 3.730, 3.845, 5.250, 3.520, 2.…
$ qsec <dbl> 17.02, 18.52, 20.00, 17.42, 17.30, 17.60, 17.05, 17.98, 16.87, 18…
$ vs   <dbl> 0, 1, 1, 0, 0, 0, 0, 0, 0, 1, 0, 0, 0, 1, 1, 0
$ am   <dbl> 1, 1, 0, 0, 0, 0, 0, 0, 0, 1, 0, 0, 1, 1, 1, 0
$ gear <dbl> 4, 4, 4, 3, 3, 3, 3, 3, 3, 4, 3, 3, 5, 4, 4, 3
$ carb <dbl> 4, 2, 2, 4, 2, 3, 2, 4, 2, 1, 3, 4, 4, 2, 1, 3

Use sample_n() to select a random number of rows from the dataset:

# Select a random 10 rows from the dataset
sampled_n <- mtcars %>%
  sample_n(10)

glimpse(sampled_n)
Rows: 10
Columns: 11
$ mpg  <dbl> 22.8, 15.8, 27.3, 15.5, 13.3, 33.9, 21.0, 19.2, 17.3, 21.4
$ cyl  <dbl> 4, 8, 4, 8, 8, 4, 6, 6, 8, 4
$ disp <dbl> 140.8, 351.0, 79.0, 318.0, 350.0, 71.1, 160.0, 167.6, 275.8, 121.0
$ hp   <dbl> 95, 264, 66, 150, 245, 65, 110, 123, 180, 109
$ drat <dbl> 3.92, 4.22, 4.08, 2.76, 3.73, 4.22, 3.90, 3.92, 3.07, 4.11
$ wt   <dbl> 3.150, 3.170, 1.935, 3.520, 3.840, 1.835, 2.875, 3.440, 3.730, 2.…
$ qsec <dbl> 22.90, 14.50, 18.90, 16.87, 15.41, 19.90, 17.02, 18.30, 17.60, 18…
$ vs   <dbl> 1, 0, 1, 0, 0, 1, 0, 1, 0, 1
$ am   <dbl> 0, 1, 1, 0, 0, 1, 1, 0, 0, 1
$ gear <dbl> 4, 5, 4, 3, 3, 4, 4, 4, 3, 4
$ carb <dbl> 2, 4, 1, 2, 4, 1, 4, 4, 3, 2

Use slice() to select specific rows by index:

# Select rows 1, 5, and 10 from the dataset
sliced_rows <- mtcars %>%
  slice(c(1, 5, 10))

head(sliced_rows)
                   mpg cyl  disp  hp drat   wt  qsec vs am gear carb
Mazda RX4         21.0   6 160.0 110 3.90 2.62 16.46  0  1    4    4
Hornet Sportabout 18.7   8 360.0 175 3.15 3.44 17.02  0  0    3    2
Merc 280          19.2   6 167.6 123 3.92 3.44 18.30  1  0    4    4

Use top_n() to select the top n rows based on a specific variable:

# Select the top 5 cars with the highest mpg
top_cars <- mtcars %>%
  top_n(5, wt = mpg)

head(top_cars)
                mpg cyl disp  hp drat    wt  qsec vs am gear carb
Fiat 128       32.4   4 78.7  66 4.08 2.200 19.47  1  1    4    1
Honda Civic    30.4   4 75.7  52 4.93 1.615 18.52  1  1    4    2
Toyota Corolla 33.9   4 71.1  65 4.22 1.835 19.90  1  1    4    1
Fiat X1-9      27.3   4 79.0  66 4.08 1.935 18.90  1  1    4    1
Lotus Europa   30.4   4 95.1 113 3.77 1.513 16.90  1  1    5    2

These functions provide various ways to sample, select, and filter rows in the mtcars dataset, allowing you to explore and analyze the data more effectively.

Filtering rows

You might want to analyze cars with specific characteristics. For instance, let’s filter the dataset to include only cars with mpg greater than 20 and hp less than 150.

# Filter cars with mpg > 20 and hp < 150
filtered_data <- mtcars %>%
  filter(mpg > 20, hp < 150)

head(filtered_data)
                mpg cyl  disp  hp drat    wt  qsec vs am gear carb
Mazda RX4      21.0   6 160.0 110 3.90 2.620 16.46  0  1    4    4
Mazda RX4 Wag  21.0   6 160.0 110 3.90 2.875 17.02  0  1    4    4
Datsun 710     22.8   4 108.0  93 3.85 2.320 18.61  1  1    4    1
Hornet 4 Drive 21.4   6 258.0 110 3.08 3.215 19.44  1  0    3    1
Merc 240D      24.4   4 146.7  62 3.69 3.190 20.00  1  0    4    2
Merc 230       22.8   4 140.8  95 3.92 3.150 22.90  1  0    4    2

Sorting data

To sort the dataset by a specific column, use the arrange() function. Let’s sort the filtered_data by mpg in descending order.

# Sort filtered_data by mpg in descending order
sorted_data <- filtered_data %>%
  arrange(desc(mpg))

head(sorted_data)
                mpg cyl  disp  hp drat    wt  qsec vs am gear carb
Toyota Corolla 33.9   4  71.1  65 4.22 1.835 19.90  1  1    4    1
Fiat 128       32.4   4  78.7  66 4.08 2.200 19.47  1  1    4    1
Honda Civic    30.4   4  75.7  52 4.93 1.615 18.52  1  1    4    2
Lotus Europa   30.4   4  95.1 113 3.77 1.513 16.90  1  1    5    2
Fiat X1-9      27.3   4  79.0  66 4.08 1.935 18.90  1  1    4    1
Porsche 914-2  26.0   4 120.3  91 4.43 2.140 16.70  0  1    5    2

Creating new columns

You might want to create a new column based on existing columns. For instance, let’s create a column called “performance” calculated as hp / wt.

# Create a new column 'performance'
with_performance <- mtcars %>%
  mutate(performance = hp / wt)

glimpse(with_performance)
Rows: 32
Columns: 12
$ mpg         <dbl> 21.0, 21.0, 22.8, 21.4, 18.7, 18.1, 14.3, 24.4, 22.8, 19.2…
$ cyl         <dbl> 6, 6, 4, 6, 8, 6, 8, 4, 4, 6, 6, 8, 8, 8, 8, 8, 8, 4, 4, 4…
$ disp        <dbl> 160.0, 160.0, 108.0, 258.0, 360.0, 225.0, 360.0, 146.7, 14…
$ hp          <dbl> 110, 110, 93, 110, 175, 105, 245, 62, 95, 123, 123, 180, 1…
$ drat        <dbl> 3.90, 3.90, 3.85, 3.08, 3.15, 2.76, 3.21, 3.69, 3.92, 3.92…
$ wt          <dbl> 2.620, 2.875, 2.320, 3.215, 3.440, 3.460, 3.570, 3.190, 3.…
$ qsec        <dbl> 16.46, 17.02, 18.61, 19.44, 17.02, 20.22, 15.84, 20.00, 22…
$ vs          <dbl> 0, 0, 1, 1, 0, 1, 0, 1, 1, 1, 1, 0, 0, 0, 0, 0, 0, 1, 1, 1…
$ am          <dbl> 1, 1, 1, 0, 0, 0, 0, 0, 0, 0, 0, 0, 0, 0, 0, 0, 0, 1, 1, 1…
$ gear        <dbl> 4, 4, 4, 3, 3, 3, 3, 4, 4, 4, 4, 3, 3, 3, 3, 3, 3, 4, 4, 4…
$ carb        <dbl> 4, 4, 1, 1, 2, 1, 4, 2, 2, 4, 4, 3, 3, 3, 4, 4, 4, 1, 2, 1…
$ performance <dbl> 41.98473, 38.26087, 40.08621, 34.21462, 50.87209, 30.34682…

Functions that are too convenient to use with select(): contains(), ends_with(), starts_with()

Firstly, we add new columns to the mtcars dataset:

# Add new columns to the mtcars dataset
mtcars_new <- mtcars %>%
  mutate(hp_disp_ratio = hp / disp,
         disp_hp_ratio = disp / hp,
         wt_mpg_ratio = wt / mpg)

glimpse(mtcars_new)
Rows: 32
Columns: 14
$ mpg           <dbl> 21.0, 21.0, 22.8, 21.4, 18.7, 18.1, 14.3, 24.4, 22.8, 19…
$ cyl           <dbl> 6, 6, 4, 6, 8, 6, 8, 4, 4, 6, 6, 8, 8, 8, 8, 8, 8, 4, 4,…
$ disp          <dbl> 160.0, 160.0, 108.0, 258.0, 360.0, 225.0, 360.0, 146.7, …
$ hp            <dbl> 110, 110, 93, 110, 175, 105, 245, 62, 95, 123, 123, 180,…
$ drat          <dbl> 3.90, 3.90, 3.85, 3.08, 3.15, 2.76, 3.21, 3.69, 3.92, 3.…
$ wt            <dbl> 2.620, 2.875, 2.320, 3.215, 3.440, 3.460, 3.570, 3.190, …
$ qsec          <dbl> 16.46, 17.02, 18.61, 19.44, 17.02, 20.22, 15.84, 20.00, …
$ vs            <dbl> 0, 0, 1, 1, 0, 1, 0, 1, 1, 1, 1, 0, 0, 0, 0, 0, 0, 1, 1,…
$ am            <dbl> 1, 1, 1, 0, 0, 0, 0, 0, 0, 0, 0, 0, 0, 0, 0, 0, 0, 1, 1,…
$ gear          <dbl> 4, 4, 4, 3, 3, 3, 3, 4, 4, 4, 4, 3, 3, 3, 3, 3, 3, 4, 4,…
$ carb          <dbl> 4, 4, 1, 1, 2, 1, 4, 2, 2, 4, 4, 3, 3, 3, 4, 4, 4, 1, 2,…
$ hp_disp_ratio <dbl> 0.6875000, 0.6875000, 0.8611111, 0.4263566, 0.4861111, 0…
$ disp_hp_ratio <dbl> 1.454545, 1.454545, 1.161290, 2.345455, 2.057143, 2.1428…
$ wt_mpg_ratio  <dbl> 0.12476190, 0.13690476, 0.10175439, 0.15023364, 0.183957…

Use contains() to select columns that contain a specific string:

# Select columns containing the string 'ratio'
ratio_columns <- mtcars_new %>%
  select(contains("ratio"))

head(ratio_columns)
                  hp_disp_ratio disp_hp_ratio wt_mpg_ratio
Mazda RX4             0.6875000      1.454545    0.1247619
Mazda RX4 Wag         0.6875000      1.454545    0.1369048
Datsun 710            0.8611111      1.161290    0.1017544
Hornet 4 Drive        0.4263566      2.345455    0.1502336
Hornet Sportabout     0.4861111      2.057143    0.1839572
Valiant               0.4666667      2.142857    0.1911602

Use ends_with() to select columns that end with a specific string:

# Select columns ending with the string 'ratio'
ending_ratio_columns <- mtcars_new %>%
  select(ends_with("ratio"))

head(ending_ratio_columns)
                  hp_disp_ratio disp_hp_ratio wt_mpg_ratio
Mazda RX4             0.6875000      1.454545    0.1247619
Mazda RX4 Wag         0.6875000      1.454545    0.1369048
Datsun 710            0.8611111      1.161290    0.1017544
Hornet 4 Drive        0.4263566      2.345455    0.1502336
Hornet Sportabout     0.4861111      2.057143    0.1839572
Valiant               0.4666667      2.142857    0.1911602

Use starts_with() to select columns that start with a specific string:

# Select columns starting with the string 'hp'
starting_hp_columns <- mtcars_new %>%
  select(starts_with("hp"))

head(starting_hp_columns)
                   hp hp_disp_ratio
Mazda RX4         110     0.6875000
Mazda RX4 Wag     110     0.6875000
Datsun 710         93     0.8611111
Hornet 4 Drive    110     0.4263566
Hornet Sportabout 175     0.4861111
Valiant           105     0.4666667

These functions are helpful when you need to select multiple columns that share a specific naming pattern, such as a common prefix or suffix. They can simplify your code and make it more readable, especially when working with large datasets containing numerous columns.


Use transmute() to create a new dataset with transformed columns:

# Create a new dataset with the mpg to km/l conversion, and engine displacement from cubic inches to liters
mtcars_transformed <- mtcars %>%
  transmute(mpg_to_kml = mpg * 0.425144, # 1 mile per gallon is approximately 0.425144 km/l
            liters = disp * 0.0163871)   # 1 cubic inch is approximately 0.0163871 liters

head(mtcars_transformed)
                  mpg_to_kml   liters
Mazda RX4           8.928024 2.621936
Mazda RX4 Wag       8.928024 2.621936
Datsun 710          9.693283 1.769807
Hornet 4 Drive      9.098082 4.227872
Hornet Sportabout   7.950193 5.899356
Valiant             7.695106 3.687098

Use rename() to rename columns in the mtcars dataset:

# Rename the 'mpg' column to 'miles_per_gallon' and the 'disp' column to 'displacement'
mtcars_renamed <- mtcars %>%
  rename(miles_per_gallon = mpg,
         displacement = disp)

head(mtcars_renamed)
                  miles_per_gallon cyl displacement  hp drat    wt  qsec vs am
Mazda RX4                     21.0   6          160 110 3.90 2.620 16.46  0  1
Mazda RX4 Wag                 21.0   6          160 110 3.90 2.875 17.02  0  1
Datsun 710                    22.8   4          108  93 3.85 2.320 18.61  1  1
Hornet 4 Drive                21.4   6          258 110 3.08 3.215 19.44  1  0
Hornet Sportabout             18.7   8          360 175 3.15 3.440 17.02  0  0
Valiant                       18.1   6          225 105 2.76 3.460 20.22  1  0
                  gear carb
Mazda RX4            4    4
Mazda RX4 Wag        4    4
Datsun 710           4    1
Hornet 4 Drive       3    1
Hornet Sportabout    3    2
Valiant              3    1

Grouping and summarizing data

Grouping data can help you understand it better. Let’s group the dataset by the number of cylinders (cyl) and calculate the average mpg for each group.

# Group data by 'cyl' and calculate average 'mpg'
grouped_data <- mtcars %>%
  group_by(cyl) %>%
  summarize(avg_mpg = mean(mpg))

grouped_data
# A tibble: 3 × 2
    cyl avg_mpg
  <dbl>   <dbl>
1     4    26.7
2     6    19.7
3     8    15.1

Calculate the median, minimum, and maximum mpg for each number of cylinders:

grouped_data_2 <- mtcars %>%
  group_by(cyl) %>%
  summarize(median_mpg = median(mpg),
            min_mpg = min(mpg),
            max_mpg = max(mpg))

grouped_data_2
# A tibble: 3 × 4
    cyl median_mpg min_mpg max_mpg
  <dbl>      <dbl>   <dbl>   <dbl>
1     4       26      21.4    33.9
2     6       19.7    17.8    21.4
3     8       15.2    10.4    19.2

Group data by the number of gears and calculate the average horsepower and engine displacement:

grouped_data_3 <- mtcars %>%
  group_by(gear) %>%
  summarize(avg_hp = mean(hp),
            avg_disp = mean(disp))

grouped_data_3
# A tibble: 3 × 3
   gear avg_hp avg_disp
  <dbl>  <dbl>    <dbl>
1     3  176.      326.
2     4   89.5     123.
3     5  196.      202.

Group data by transmission type (automatic or manual) and calculate the average mpg, total horsepower, and number of cars in each group:

grouped_data_4 <- mtcars %>%
  group_by(am) %>%
  summarize(avg_mpg = mean(mpg),
            total_hp = sum(hp),
            num_cars = n())

grouped_data_4
# A tibble: 2 × 4
     am avg_mpg total_hp num_cars
  <dbl>   <dbl>    <dbl>    <int>
1     0    17.1     3045       19
2     1    24.4     1649       13

Handling missing values

If your dataset has missing values, you can use tidyr’s drop_na() function to remove rows with missing values or replace_na() function to replace missing values with a specified value.

For this tutorial, let’s artificially introduce missing values in the mtcars dataset and then perform missing value handling.

# Introduce missing values to mtcars dataset
set.seed(42)
mtcars_with_na <- mtcars %>%
  mutate(mpg = ifelse(runif(n()) < 0.1, NA, mpg))

# Check for missing values
summary(mtcars_with_na)
      mpg             cyl             disp             hp       
 Min.   :10.40   Min.   :4.000   Min.   : 71.1   Min.   : 52.0  
 1st Qu.:15.35   1st Qu.:4.000   1st Qu.:120.8   1st Qu.: 96.5  
 Median :19.20   Median :6.000   Median :196.3   Median :123.0  
 Mean   :20.12   Mean   :6.188   Mean   :230.7   Mean   :146.7  
 3rd Qu.:22.80   3rd Qu.:8.000   3rd Qu.:326.0   3rd Qu.:180.0  
 Max.   :33.90   Max.   :8.000   Max.   :472.0   Max.   :335.0  
 NA's   :1                                                      
      drat             wt             qsec             vs        
 Min.   :2.760   Min.   :1.513   Min.   :14.50   Min.   :0.0000  
 1st Qu.:3.080   1st Qu.:2.581   1st Qu.:16.89   1st Qu.:0.0000  
 Median :3.695   Median :3.325   Median :17.71   Median :0.0000  
 Mean   :3.597   Mean   :3.217   Mean   :17.85   Mean   :0.4375  
 3rd Qu.:3.920   3rd Qu.:3.610   3rd Qu.:18.90   3rd Qu.:1.0000  
 Max.   :4.930   Max.   :5.424   Max.   :22.90   Max.   :1.0000  
                                                                 
       am              gear            carb      
 Min.   :0.0000   Min.   :3.000   Min.   :1.000  
 1st Qu.:0.0000   1st Qu.:3.000   1st Qu.:2.000  
 Median :0.0000   Median :4.000   Median :2.000  
 Mean   :0.4062   Mean   :3.688   Mean   :2.812  
 3rd Qu.:1.0000   3rd Qu.:4.000   3rd Qu.:4.000  
 Max.   :1.0000   Max.   :5.000   Max.   :8.000  
                                                 

Removing rows with missing values

# Remove rows with missing values in 'mpg' column
no_na_rows <- mtcars_with_na %>%
  drop_na(mpg)

summary(no_na_rows)
      mpg             cyl             disp             hp       
 Min.   :10.40   Min.   :4.000   Min.   : 71.1   Min.   : 52.0  
 1st Qu.:15.35   1st Qu.:4.000   1st Qu.:120.7   1st Qu.: 96.0  
 Median :19.20   Median :6.000   Median :167.6   Median :123.0  
 Mean   :20.12   Mean   :6.129   Mean   :225.3   Mean   :145.8  
 3rd Qu.:22.80   3rd Qu.:8.000   3rd Qu.:311.0   3rd Qu.:180.0  
 Max.   :33.90   Max.   :8.000   Max.   :472.0   Max.   :335.0  
      drat             wt             qsec             vs        
 Min.   :2.760   Min.   :1.513   Min.   :14.50   Min.   :0.0000  
 1st Qu.:3.115   1st Qu.:2.542   1st Qu.:16.89   1st Qu.:0.0000  
 Median :3.700   Median :3.215   Median :17.82   Median :0.0000  
 Mean   :3.613   Mean   :3.197   Mean   :17.87   Mean   :0.4516  
 3rd Qu.:3.920   3rd Qu.:3.570   3rd Qu.:18.90   3rd Qu.:1.0000  
 Max.   :4.930   Max.   :5.424   Max.   :22.90   Max.   :1.0000  
       am              gear           carb      
 Min.   :0.0000   Min.   :3.00   Min.   :1.000  
 1st Qu.:0.0000   1st Qu.:3.00   1st Qu.:2.000  
 Median :0.0000   Median :4.00   Median :2.000  
 Mean   :0.4194   Mean   :3.71   Mean   :2.839  
 3rd Qu.:1.0000   3rd Qu.:4.00   3rd Qu.:4.000  
 Max.   :1.0000   Max.   :5.00   Max.   :8.000  

Replacing missing values

If you want to replace missing values with a specific value or the mean value of the column, use the replace_na() function.

# Replace missing values in 'mpg' column with the mean value
mean_mpg <- mean(mtcars$mpg, na.rm = TRUE)
replaced_na <- mtcars_with_na %>%
  mutate(mpg = replace_na(mpg, mean_mpg))

summary(replaced_na)
      mpg             cyl             disp             hp       
 Min.   :10.40   Min.   :4.000   Min.   : 71.1   Min.   : 52.0  
 1st Qu.:15.43   1st Qu.:4.000   1st Qu.:120.8   1st Qu.: 96.5  
 Median :19.45   Median :6.000   Median :196.3   Median :123.0  
 Mean   :20.12   Mean   :6.188   Mean   :230.7   Mean   :146.7  
 3rd Qu.:22.80   3rd Qu.:8.000   3rd Qu.:326.0   3rd Qu.:180.0  
 Max.   :33.90   Max.   :8.000   Max.   :472.0   Max.   :335.0  
      drat             wt             qsec             vs        
 Min.   :2.760   Min.   :1.513   Min.   :14.50   Min.   :0.0000  
 1st Qu.:3.080   1st Qu.:2.581   1st Qu.:16.89   1st Qu.:0.0000  
 Median :3.695   Median :3.325   Median :17.71   Median :0.0000  
 Mean   :3.597   Mean   :3.217   Mean   :17.85   Mean   :0.4375  
 3rd Qu.:3.920   3rd Qu.:3.610   3rd Qu.:18.90   3rd Qu.:1.0000  
 Max.   :4.930   Max.   :5.424   Max.   :22.90   Max.   :1.0000  
       am              gear            carb      
 Min.   :0.0000   Min.   :3.000   Min.   :1.000  
 1st Qu.:0.0000   1st Qu.:3.000   1st Qu.:2.000  
 Median :0.0000   Median :4.000   Median :2.000  
 Mean   :0.4062   Mean   :3.688   Mean   :2.812  
 3rd Qu.:1.0000   3rd Qu.:4.000   3rd Qu.:4.000  
 Max.   :1.0000   Max.   :5.000   Max.   :8.000  

QZs

  1. Using the mtcars dataset, filter the data to only include cars with a manual transmission (am = 1) and sort the result by miles per gallon (mpg) in descending order. What are the top 3 cars in terms of mpg?
  • Mazda RX4, Mazda RX4 Wag, Datsun 710
  • Fiat 128, Honda Civic, Toyota Corolla
  • Lotus Europa, Porsche 914-2, Ford Pantera L


  1. Using the mtcars dataset, group the data by the number of cylinders (cyl) and calculate the average miles per gallon (mpg) for each group. Which group of cars has the highest average mpg?
  • 4 cylinders
  • 6 cylinders
  • 8 cylinders


  1. Using the mtcars dataset, create a new column called “mpg_kml” that converts the mpg values to km/l (1 mile per gallon is approximately 0.425144 km/l). Then, rename the “mpg” column to “miles_per_gallon”.


  1. Let’s use gapminder dataset. Calculate the average GDP per capita for each continent and display the results in descending order.
if (!requireNamespace("gapminder", quietly = TRUE)) {
  install.packages("gapminder")
}

library(gapminder)
gapminder %>% head
# A tibble: 6 × 6
  country     continent  year lifeExp      pop gdpPercap
  <fct>       <fct>     <int>   <dbl>    <int>     <dbl>
1 Afghanistan Asia       1952    28.8  8425333      779.
2 Afghanistan Asia       1957    30.3  9240934      821.
3 Afghanistan Asia       1962    32.0 10267083      853.
4 Afghanistan Asia       1967    34.0 11537966      836.
5 Afghanistan Asia       1972    36.1 13079460      740.
6 Afghanistan Asia       1977    38.4 14880372      786.


  1. Filter the dataset for the year 2007 and randomly select 100 countries. Then, arrange these countries in descending order of life expectancy and display the top 5 countries with the highest life expectancy.


Combining datasets

Sometimes, you may need to combine datasets. You can use dplyr’s bind_rows() function to combine datasets vertically (by rows) and bind_cols() function to combine datasets horizontally (by columns).

For this tutorial, let’s create two datasets and then combine them.

# Create two datasets
dataset_1 <- mtcars %>%
  filter(cyl == 4) %>% 
  head(3)

dataset_1
            mpg cyl  disp hp drat   wt  qsec vs am gear carb
Datsun 710 22.8   4 108.0 93 3.85 2.32 18.61  1  1    4    1
Merc 240D  24.4   4 146.7 62 3.69 3.19 20.00  1  0    4    2
Merc 230   22.8   4 140.8 95 3.92 3.15 22.90  1  0    4    2
dataset_2 <- mtcars %>%
  filter(cyl == 6) %>% 
  head(3)

dataset_2
                mpg cyl disp  hp drat    wt  qsec vs am gear carb
Mazda RX4      21.0   6  160 110 3.90 2.620 16.46  0  1    4    4
Mazda RX4 Wag  21.0   6  160 110 3.90 2.875 17.02  0  1    4    4
Hornet 4 Drive 21.4   6  258 110 3.08 3.215 19.44  1  0    3    1
# Combine datasets vertically
combined_data <- bind_rows(dataset_1, dataset_2)

# Check the combined data
combined_data
                mpg cyl  disp  hp drat    wt  qsec vs am gear carb
Datsun 710     22.8   4 108.0  93 3.85 2.320 18.61  1  1    4    1
Merc 240D      24.4   4 146.7  62 3.69 3.190 20.00  1  0    4    2
Merc 230       22.8   4 140.8  95 3.92 3.150 22.90  1  0    4    2
Mazda RX4      21.0   6 160.0 110 3.90 2.620 16.46  0  1    4    4
Mazda RX4 Wag  21.0   6 160.0 110 3.90 2.875 17.02  0  1    4    4
Hornet 4 Drive 21.4   6 258.0 110 3.08 3.215 19.44  1  0    3    1

Table Joining

In this section, we’ll demonstrate how to join tables using dplyr’s join functions. We will use a new dataset called “car_brands” that contains information about each car’s brand.

# Create a car_brands dataset
car_brands <- tibble(
  car_name = rownames(mtcars),
  brand = c(rep("Mazda", 2), rep("Datsun", 1), rep("Hornet", 2), 
            rep("Valiant", 1), rep("Duster", 1), rep("Merc", 7), 
            rep("Cadillac", 1), rep("Lincoln", 1), rep("Chrysler", 1), 
            rep("Fiat", 2), rep("Honda", 1), rep("Toyota", 2), 
            rep("Dodge", 1), rep("AMC", 1), rep("Camaro", 1), 
            rep("Pontiac", 1), rep("Porsche", 1), rep("Lotus", 1), 
            rep("Ford", 1), rep("Ferrari", 1), rep("Maserati", 1), 
            rep("Volvo", 1))
)

car_brands
# A tibble: 32 × 2
   car_name          brand  
   <chr>             <chr>  
 1 Mazda RX4         Mazda  
 2 Mazda RX4 Wag     Mazda  
 3 Datsun 710        Datsun 
 4 Hornet 4 Drive    Hornet 
 5 Hornet Sportabout Hornet 
 6 Valiant           Valiant
 7 Duster 360        Duster 
 8 Merc 240D         Merc   
 9 Merc 230          Merc   
10 Merc 280          Merc   
# ℹ 22 more rows
# Convert rownames of mtcars to a column called "car_name"
mtcars <- mtcars %>%
  rownames_to_column(var = "car_name")

mtcars %>% glimpse
Rows: 32
Columns: 12
$ car_name <chr> "Mazda RX4", "Mazda RX4 Wag", "Datsun 710", "Hornet 4 Drive",…
$ mpg      <dbl> 21.0, 21.0, 22.8, 21.4, 18.7, 18.1, 14.3, 24.4, 22.8, 19.2, 1…
$ cyl      <dbl> 6, 6, 4, 6, 8, 6, 8, 4, 4, 6, 6, 8, 8, 8, 8, 8, 8, 4, 4, 4, 4…
$ disp     <dbl> 160.0, 160.0, 108.0, 258.0, 360.0, 225.0, 360.0, 146.7, 140.8…
$ hp       <dbl> 110, 110, 93, 110, 175, 105, 245, 62, 95, 123, 123, 180, 180,…
$ drat     <dbl> 3.90, 3.90, 3.85, 3.08, 3.15, 2.76, 3.21, 3.69, 3.92, 3.92, 3…
$ wt       <dbl> 2.620, 2.875, 2.320, 3.215, 3.440, 3.460, 3.570, 3.190, 3.150…
$ qsec     <dbl> 16.46, 17.02, 18.61, 19.44, 17.02, 20.22, 15.84, 20.00, 22.90…
$ vs       <dbl> 0, 0, 1, 1, 0, 1, 0, 1, 1, 1, 1, 0, 0, 0, 0, 0, 0, 1, 1, 1, 1…
$ am       <dbl> 1, 1, 1, 0, 0, 0, 0, 0, 0, 0, 0, 0, 0, 0, 0, 0, 0, 1, 1, 1, 0…
$ gear     <dbl> 4, 4, 4, 3, 3, 3, 3, 4, 4, 4, 4, 3, 3, 3, 3, 3, 3, 4, 4, 4, 3…
$ carb     <dbl> 4, 4, 1, 1, 2, 1, 4, 2, 2, 4, 4, 3, 3, 3, 4, 4, 4, 1, 2, 1, 1…

Inner join

Inner join returns only the rows with matching keys in both tables.

See the types of joins below.

# Perform inner join
inner_joined <- mtcars %>%
  inner_join(car_brands, by = "car_name")

head(inner_joined)
           car_name  mpg cyl disp  hp drat    wt  qsec vs am gear carb   brand
1         Mazda RX4 21.0   6  160 110 3.90 2.620 16.46  0  1    4    4   Mazda
2     Mazda RX4 Wag 21.0   6  160 110 3.90 2.875 17.02  0  1    4    4   Mazda
3        Datsun 710 22.8   4  108  93 3.85 2.320 18.61  1  1    4    1  Datsun
4    Hornet 4 Drive 21.4   6  258 110 3.08 3.215 19.44  1  0    3    1  Hornet
5 Hornet Sportabout 18.7   8  360 175 3.15 3.440 17.02  0  0    3    2  Hornet
6           Valiant 18.1   6  225 105 2.76 3.460 20.22  1  0    3    1 Valiant

Left join

Left join returns all the rows from the left table and the matched rows from the right table. If no match is found, NA values are returned for right table columns.

# Perform left join
left_joined <- mtcars %>%
  left_join(car_brands, by = "car_name")

head(left_joined)
           car_name  mpg cyl disp  hp drat    wt  qsec vs am gear carb   brand
1         Mazda RX4 21.0   6  160 110 3.90 2.620 16.46  0  1    4    4   Mazda
2     Mazda RX4 Wag 21.0   6  160 110 3.90 2.875 17.02  0  1    4    4   Mazda
3        Datsun 710 22.8   4  108  93 3.85 2.320 18.61  1  1    4    1  Datsun
4    Hornet 4 Drive 21.4   6  258 110 3.08 3.215 19.44  1  0    3    1  Hornet
5 Hornet Sportabout 18.7   8  360 175 3.15 3.440 17.02  0  0    3    2  Hornet
6           Valiant 18.1   6  225 105 2.76 3.460 20.22  1  0    3    1 Valiant

Pivoting

pivot_longer

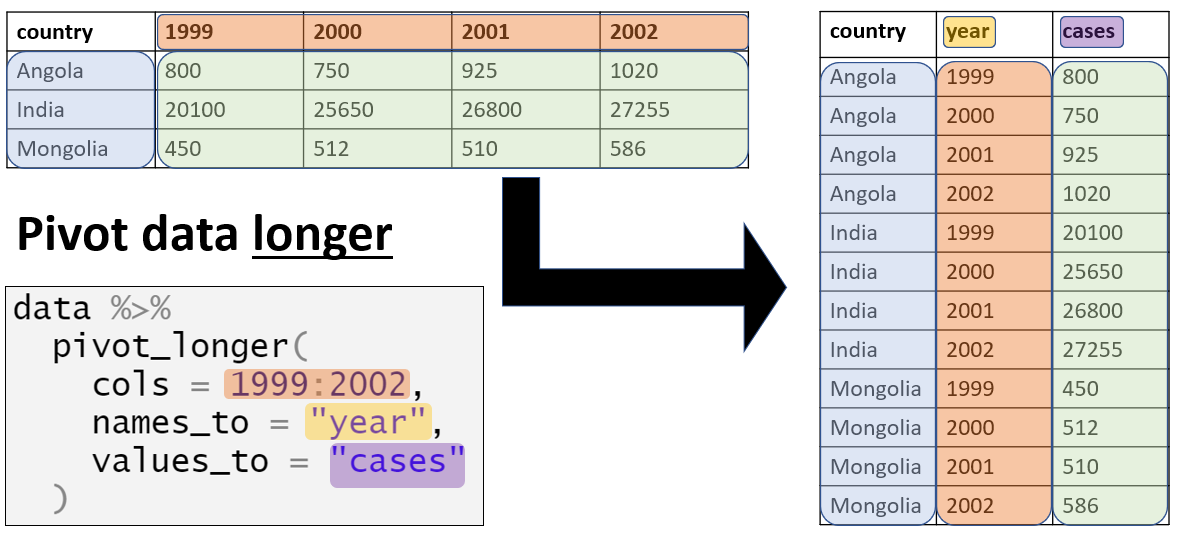
pivot_longer() is used to transform a dataset from “wide” to “long” format. It takes multiple columns and collapses them into key-value pairs.

For this example, we’ll create a dataset called “car_data” to demonstrate the pivot_longer() function.

# Create a car_data dataset
car_data <- tibble(
  car_name = c("Mazda RX4", "Mazda RX4 Wag", "Datsun 710"),
  mpg = c(21.0, 21.0, 22.8),
  hp = c(110, 110, 93),
  wt = c(2.620, 2.875, 2.320)
)
car_data
# A tibble: 3 × 4
  car_name        mpg    hp    wt
  <chr>         <dbl> <dbl> <dbl>
1 Mazda RX4      21     110  2.62
2 Mazda RX4 Wag  21     110  2.88
3 Datsun 710     22.8    93  2.32

Use pivot_longer to collapse the ‘mpg’, ‘hp’, and ‘wt’ columns into key-value pairs.

# Transform car_data from wide to long format
long_car_data <- car_data %>%
  pivot_longer(cols = c(mpg, hp, wt),
               names_to = "variable",
               values_to = "value")

long_car_data
# A tibble: 9 × 3
  car_name      variable  value
  <chr>         <chr>     <dbl>
1 Mazda RX4     mpg       21   
2 Mazda RX4     hp       110   
3 Mazda RX4     wt         2.62
4 Mazda RX4 Wag mpg       21   
5 Mazda RX4 Wag hp       110   
6 Mazda RX4 Wag wt         2.88
7 Datsun 710    mpg       22.8 
8 Datsun 710    hp        93   
9 Datsun 710    wt         2.32

pivot_wider

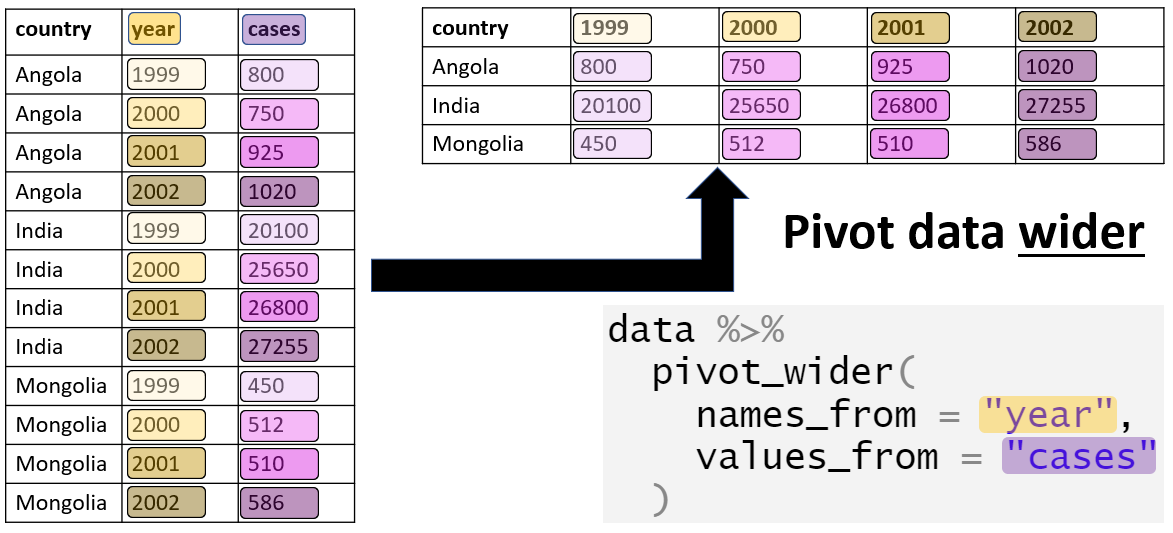
pivot_wider() is used to transform a dataset from “long” to “wide” format. It spreads key-value pairs across multiple columns.

For this example, we’ll use the “long_car_data” dataset created in the previous step.

# Transform long_car_data back to wide format
wide_car_data <- long_car_data %>%
  pivot_wider(names_from = variable,
              values_from = value)

print(wide_car_data)
# A tibble: 3 × 4
  car_name        mpg    hp    wt
  <chr>         <dbl> <dbl> <dbl>
1 Mazda RX4      21     110  2.62
2 Mazda RX4 Wag  21     110  2.88
3 Datsun 710     22.8    93  2.32

Additional data wrangling tasks

Counting occurrences

To count the occurrences of a specific value or group of values in a dataset, use the count() function.

# Count the occurrences of each brand in the car_brands dataset
brand_counts <- car_brands %>%
  count(brand, sort = TRUE)

brand_counts
# A tibble: 22 × 2
   brand        n
   <chr>    <int>
 1 Merc         7
 2 Fiat         2
 3 Hornet       2
 4 Mazda        2
 5 Toyota       2
 6 AMC          1
 7 Cadillac     1
 8 Camaro       1
 9 Chrysler     1
10 Datsun       1
# ℹ 12 more rows

Nesting and unnesting

Nesting and unnesting data can be useful for performing operations on grouped data. Let’s demonstrate this by calculating the mean mpg for each brand.

# Nest the mtcars dataset by brand
head(left_joined)
           car_name  mpg cyl disp  hp drat    wt  qsec vs am gear carb   brand
1         Mazda RX4 21.0   6  160 110 3.90 2.620 16.46  0  1    4    4   Mazda
2     Mazda RX4 Wag 21.0   6  160 110 3.90 2.875 17.02  0  1    4    4   Mazda
3        Datsun 710 22.8   4  108  93 3.85 2.320 18.61  1  1    4    1  Datsun
4    Hornet 4 Drive 21.4   6  258 110 3.08 3.215 19.44  1  0    3    1  Hornet
5 Hornet Sportabout 18.7   8  360 175 3.15 3.440 17.02  0  0    3    2  Hornet
6           Valiant 18.1   6  225 105 2.76 3.460 20.22  1  0    3    1 Valiant
nested_data <- left_joined %>%
  group_by(brand) %>%
  nest()

nested_data
# A tibble: 22 × 2
# Groups:   brand [22]
   brand    data             
   <chr>    <list>           
 1 Mazda    <tibble [2 × 12]>
 2 Datsun   <tibble [1 × 12]>
 3 Hornet   <tibble [2 × 12]>
 4 Valiant  <tibble [1 × 12]>
 5 Duster   <tibble [1 × 12]>
 6 Merc     <tibble [7 × 12]>
 7 Cadillac <tibble [1 × 12]>
 8 Lincoln  <tibble [1 × 12]>
 9 Chrysler <tibble [1 × 12]>
10 Fiat     <tibble [2 × 12]>
# ℹ 12 more rows
# Calculate mean mpg for each brand
mean_mpg_by_brand <- nested_data %>%
  mutate(mean_mpg = map_dbl(data, ~ mean(.x$mpg, na.rm = TRUE)))
mean_mpg_by_brand
# A tibble: 22 × 3
# Groups:   brand [22]
   brand    data              mean_mpg
   <chr>    <list>               <dbl>
 1 Mazda    <tibble [2 × 12]>     21  
 2 Datsun   <tibble [1 × 12]>     22.8
 3 Hornet   <tibble [2 × 12]>     20.0
 4 Valiant  <tibble [1 × 12]>     18.1
 5 Duster   <tibble [1 × 12]>     14.3
 6 Merc     <tibble [7 × 12]>     19.0
 7 Cadillac <tibble [1 × 12]>     10.4
 8 Lincoln  <tibble [1 × 12]>     10.4
 9 Chrysler <tibble [1 × 12]>     14.7
10 Fiat     <tibble [2 × 12]>     31.4
# ℹ 12 more rows
# Unnest the nested data
unnested_data <- mean_mpg_by_brand %>%
  unnest(cols = data)

head(unnested_data)
# A tibble: 6 × 14
# Groups:   brand [4]
  brand   car_name     mpg   cyl  disp    hp  drat    wt  qsec    vs    am  gear
  <chr>   <chr>      <dbl> <dbl> <dbl> <dbl> <dbl> <dbl> <dbl> <dbl> <dbl> <dbl>
1 Mazda   Mazda RX4   21       6   160   110  3.9   2.62  16.5     0     1     4
2 Mazda   Mazda RX4…  21       6   160   110  3.9   2.88  17.0     0     1     4
3 Datsun  Datsun 710  22.8     4   108    93  3.85  2.32  18.6     1     1     4
4 Hornet  Hornet 4 …  21.4     6   258   110  3.08  3.22  19.4     1     0     3
5 Hornet  Hornet Sp…  18.7     8   360   175  3.15  3.44  17.0     0     0     3
6 Valiant Valiant     18.1     6   225   105  2.76  3.46  20.2     1     0     3
# ℹ 2 more variables: carb <dbl>, mean_mpg <dbl>

Window functions

Window functions perform calculations across a set of rows related to the current row. Let’s calculate the rank of each car within its brand based on mpg.

# Calculate rank within brand by mpg
ranking_by_mpg <- left_joined %>%
  group_by(brand) %>%
  mutate(rank = dense_rank(desc(mpg)))

head(ranking_by_mpg)
# A tibble: 6 × 14
# Groups:   brand [4]
  car_name       mpg   cyl  disp    hp  drat    wt  qsec    vs    am  gear  carb
  <chr>        <dbl> <dbl> <dbl> <dbl> <dbl> <dbl> <dbl> <dbl> <dbl> <dbl> <dbl>
1 Mazda RX4     21       6   160   110  3.9   2.62  16.5     0     1     4     4
2 Mazda RX4 W…  21       6   160   110  3.9   2.88  17.0     0     1     4     4
3 Datsun 710    22.8     4   108    93  3.85  2.32  18.6     1     1     4     1
4 Hornet 4 Dr…  21.4     6   258   110  3.08  3.22  19.4     1     0     3     1
5 Hornet Spor…  18.7     8   360   175  3.15  3.44  17.0     0     0     3     2
6 Valiant       18.1     6   225   105  2.76  3.46  20.2     1     0     3     1
# ℹ 2 more variables: brand <chr>, rank <int>