library(shiny)

ui <- fluidPage(
  titlePanel("Hello Shiny!"),
  sidebarLayout(
    sidebarPanel(
      sliderInput("bins",
                  "Number of bins:",
                  min = 1,
                  max = 50,
                  value = 30)
    ),
    mainPanel(
      plotOutput("distPlot")
    )
  )
)Interactive Web: Shiny
Let your data Shiny
Pre-class video
Shiny Introduction
Book: Mastering Shiny
https://mastering-shiny.org/index.html
Class
Introduction to R Shiny
What is R Shiny?
Use cases and applications.
Basic structure of a Shiny app.
Building Your First Shiny App
Setting up the environment.
Creating the user interface (UI).
Writing the server function.
Running the app.
Adding Reactivity
Understanding reactivity in Shiny.
Using reactive expressions.
Creating reactive outputs.
Hands-On Practice
1. Introduction to R Shiny
What is R Shiny?
R Shiny is an R package that makes it easy to build interactive web applications (apps) straight from R.
A web application framework for R.
Allows building interactive web apps directly from R.
Use cases and applications:
Data visualization dashboards.
Interactive data analysis tools.
Prototyping and demonstrating models.
See an example!
Basic structure of a Shiny app:
ui.R: Defines the user interface.server.R: Contains the server logic.app.R: Combines UI and server into a single file.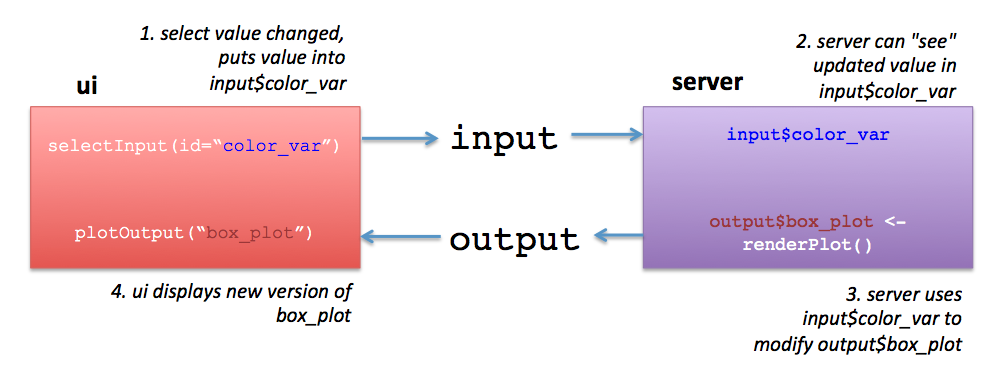
2. Building Your First Shiny App
Setting up the environment:
Install Shiny:
install.packages("shiny")Load Shiny:
library(shiny)
Data in use
The
faithfulDataset
Description: The
faithfuldataset is a built-in dataset in R that contains observations from the Old Faithful geyser in Yellowstone National Park, USA. It is commonly used for teaching and demonstrating data analysis techniques because it has a straightforward structure and interesting patterns.Dataset Structure:
The dataset consists of 272 observations on 2 variables.
The variables are:
eruptions: The duration of the geyser eruptions in minutes.
waiting: The waiting time in minutes between eruptions.
We will display the histogram of Old Faithful’s waiting time varying the number of bins
Creating the user interface (UI):
- Elements
fluidPage(): Creates a fluid page layout that adjusts its elements based on the size of the browser window. This makes the app responsive and ensures it looks good on different screen sizes.titlePanel(): Adds a title to the app, typically displayed at the top of the page. It gives users an idea of what the app is about.sidebarLayout(): Creates a layout with a sidebar and a main panel. The sidebar is usually used for inputs, and the main panel is used for outputs like plots or tables.sidebarPanel(): Defines the content of the sidebar. This is where you place input controls like sliders, dropdowns, and buttons.sliderInput(): Creates a slider input control that allows users to select a numeric value by dragging a handle along a track.mainPanel(): Defines the main content area where outputs are displayed. This is where you place elements like plots, tables, and text outputs.plotOutput(): Creates an area for rendering a plot output. The actual plot is generated by the server function and displayed in this area.
- Writing the server function:
server <- function(input, output) {
  output$distPlot <- renderPlot({
    x <- faithful$waiting
    bins <- seq(min(x), max(x), length.out = input$bins + 1)
    hist(x, breaks = bins, col = 'darkgray', border = 'white')
  })
}- Elements
server: Defines the server logic.input: Contains input values from the UI.output: Contains output objects to be sent to the UI.renderPlot(): Renders a plot based on the inputs.
- Running the app:
# shinyApp(ui = ui, server = server)Elements
shinyApp(): Combines the UI and server components to create a Shiny app.ui: The user interface component.server: The server logic component.
3. Adding Reactivity
Understanding reactivity in Shiny:
Reactive inputs and outputs.
Reactive expressions:
reactive()
Using reactive expressions:
server <- function(input, output) {

    reactive_hist_data <- reactive({
    x <- faithful$waiting
    bins <- seq(min(x), max(x), length.out = input$bins + 1)
    list(x = x, bins = bins)
  })

  output$distPlot <- renderPlot({
    hist_data <- reactive_hist_data()
    hist(hist_data$x, breaks = hist_data$bins, col = 'darkgray', border = 'white')
  })

}
In this simple example, the result of the histogram plot might look the same whether you use a reactive expression or not. The benefit of using a reactive expression becomes more apparent in more complex applications where you want to reuse the reactive computation in multiple places or when you have more complex dependencies.
Let’s clarify the purpose of using a reactive expression and demonstrate a more nuanced example where its use is beneficial.
Why Use reactive?
Reusability:
- If you need the computed data in multiple places within your server logic, using a
reactiveexpression prevents the need to duplicate code.
- If you need the computed data in multiple places within your server logic, using a
Efficiency:
- Reactive expressions cache their results. If the inputs haven’t changed, Shiny can use the cached result instead of re-evaluating the expression.
Complex Dependencies:
- In more complex apps with multiple reactive inputs and outputs, managing dependencies and ensuring that everything updates correctly can be challenging. Reactive expressions help by encapsulating these dependencies clearly.
More Advanced Example
Let’s consider a more advanced example where we compute multiple reactive outputs based on the same reactive data.
Example: Interactive Histogram with Summary Statistics
In this example, we will:
Create a histogram based on user input.
Display summary statistics (mean, median, and standard deviation) that update based on the user’s bin selection.
library(shiny)

# Define UI
ui <- fluidPage(
  titlePanel("Interactive Histogram with Summary Statistics"),
  sidebarLayout(
    sidebarPanel(
      sliderInput("bins", "Number of bins:", min = 1, max = 50, value = 30)
    ),
    mainPanel(
      plotOutput("distPlot"),
      textOutput("summaryStats")
    )
  )
)

# Define server logic
server <- function(input, output) {

  # Reactive expression to compute histogram data
  reactive_hist_data <- reactive({
    x <- faithful$waiting
    bins <- seq(min(x), max(x), length.out = input$bins + 1)
    list(x = x, bins = bins)
  })

  # Render histogram plot
  output$distPlot <- renderPlot({
    hist_data <- reactive_hist_data()
    hist(hist_data$x, breaks = hist_data$bins, col = 'darkgray', border = 'white',
         main = "Histogram of Waiting Times",
         xlab = "Waiting Time (minutes)")
  })

  # Render summary statistics
  output$summaryStats <- renderText({
    hist_data <- reactive_hist_data()
    x <- hist_data$x
    mean_val <- mean(x)
    median_val <- median(x)
    sd_val <- sd(x)
    paste("Mean: ", round(mean_val, 2),
          "Median: ", round(median_val, 2),
          "SD: ", round(sd_val, 2))
  })
}

# Run the application

# shinyApp(ui = ui, server = server)
4. Hands-On Practice
Step-by-step guided coding of a simple Shiny app:
- Start with a basic template:
library(shiny)

ui <- fluidPage(
  titlePanel("Basic Shiny App"),
  sidebarLayout(
    sidebarPanel(
      sliderInput("bins", "Number of bins:", min = 1, max = 50, value = 30)
    ),
    mainPanel(
      plotOutput("distPlot")
    )
  )
)

server <- function(input, output) {
  output$distPlot <- renderPlot({
    x <- faithful$waiting
    bins <- seq(min(x), max(x), length.out = input$bins + 1)
    hist(x, breaks = bins, col = 'darkgray', border = 'white')
  })
}

# shinyApp(ui = ui, server = server)
Adding features to the app:
- Adding another input and output.
ui <- fluidPage(
  titlePanel("Enhanced Shiny App"),
  sidebarLayout(
    sidebarPanel(
      sliderInput("bins", "Number of bins:", min = 1, max = 50, value = 30),
      selectInput("color", "Choose color:", choices = c("darkgray", "blue", "green"))
    ),
    mainPanel(
      plotOutput("distPlot")
    )
  )
)

server <- function(input, output) {
  output$distPlot <- renderPlot({
    x <- faithful$waiting
    bins <- seq(min(x), max(x), length.out = input$bins + 1)
    hist(x, breaks = bins, col = input$color, border = 'white')
  })
}


# shinyApp(ui = ui, server = server)
We use
selectInput()here.There are many buttons and widgets you can use in Shiny
Advanced one (for practice)
library(shiny)
library(ggplot2)

# Define UI
ui <- fluidPage(
  titlePanel("Simple Data Analyzer"),
  sidebarLayout(
    sidebarPanel(
      helpText("Enter numeric data separated by commas (e.g., 1, 2, 3, 4, 5)"),
      textInput("dataInput", "Enter data:", value = ""),
      actionButton("submit", "Submit"),
      hr(),
      helpText("Output Plot and Statistics")
    ),
    mainPanel(
      plotOutput("dataPlot"),
      verbatimTextOutput("dataSummary")
    )
  )
)

# Define server logic
server <- function(input, output) {
  data <- reactive({
    req(input$submit)  # Wait until the submit button is clicked
    as.numeric(unlist(strsplit(input$dataInput, ",")))
  })

  output$dataPlot <- renderPlot({
    req(data())  # Ensure data is available
    ggplot(data = data.frame(x = data()), aes(x = x)) +
      geom_histogram(binwidth = 1, fill = "blue", color = "white") +
      theme_minimal() +
      labs(title = "Histogram of Data", x = "Data Values", y = "Count")
  })

  output$dataSummary <- renderPrint({
    req(data())  # Ensure data is available
    summary <- summary(data())
    c("Data Summary:", paste("Mean =", mean(data(), na.rm = TRUE)),
      paste("Variance =", var(data(), na.rm = TRUE)),
      paste("N =", length(data())))
  })
}

# Run the application

# shinyApp(ui = ui, server = server)
Explanation:
TextInput: Users can enter their data as comma-separated values.
ActionButton: A button that users click to submit their data. The server logic processes the data only after the button is clicked.
Reactive expression:
datais a reactive expression that only updates when the submit button is clicked and the input data changes.PlotOutput and TextOutput: These display the plot and data summary, respectively.
Why Use
req()?- Using
req()is important for preventing errors and ensuring that your Shiny app behaves correctly. For example, you might want to ensure that some input data is available before generating a plot or a table. If the required data is not available,req()will prevent the subsequent code from running, which could otherwise lead to errors or unintended behavior.
- Using
Use ChatGPT or other genAI to modify this shiny app:
Add things like below:
A widget to choose the color of the bars in the histogram.
A boxplot of the selected dataset’s variable.
Further Study (Now, it’s your turn!)
To deepen your understanding and improve your skills with R Shiny, here are some additional resources that will be helpful.
Gallery of Shiny Apps
Explore Examples and Benchmark Your Code:
Shiny Gallery: The official Shiny Gallery by RStudio showcases a variety of Shiny apps, ranging from simple to complex. You can view the source code for each app and use it as a benchmark for your own projects.
Shiny Demos
Recommended Textbooks
Books for In-Depth Learning:
Mastering Shiny by Hadley Wickham
A comprehensive guide to building interactive web applications with R Shiny. The book covers the basics as well as advanced topics, including reactivity, UI layout, and deploying Shiny apps.
R Shiny by Example by Jonathan Owen and Joe Cheng
This book presents various Shiny applications and explains the underlying code, making it easier to understand and implement Shiny functionalities in your own projects.
Other Educational Materials
Online Courses, Tutorials, and Community Resources:
RStudio Shiny Tutorial: A beginner-friendly tutorial from RStudio that introduces the basics of Shiny, including building and deploying Shiny apps.
Coursera - Developing Data Products by Johns Hopkins University: This online course covers the development of data products, including Shiny apps. It’s part of the Data Science Specialization.
DataCamp - Building Web Applications in R with Shiny: An interactive course that teaches you how to build Shiny apps from scratch, with hands-on exercises and projects.